First and foremost, if feasible, please consider a Hotspot JVM upgrade. The 1.4.2 JVM is outdated and there have been several significant improvements to GC ergonomics in later Hotspot JVMs. The JDK 1.4.2 Standard edition reached its EOL in late 2008. However, you can purchase support for later updates of JDK 1.4.2 (later than 1.4.2_19) that are branded under Java For Business (JFB) v1.4.2, to receive security updates and critical fixes until 2013. With regards to CMS, Sun engineers were finding their feet with CMS in JVM 1.4.2, enhanced CMS and made it the default collector in JVMs 5 and 6 and are about to replace CMS with G1 (Generation First) in JVM 7.
For those of you still using the Concurrent Mark Sweep (CMS) garbage collector with Hotspot JVM 1.4.2, here’s some information which I hope you will find useful.
What is CMS garbage collector?
The Concurrent (actually mostly concurrent) Mark Sweep (CMS) garbage collector is a non-default old (tenured) generation garbage collector introduced in JVM 1.4 that manages a JVM’s heap by collecting garbage in the old (tenured) generation in a few phases, some of which are concurrent and the others which are stop-the-world. As a consequence of the concurrent phases, this collector minimizes GC pauses and hence is also referred to as the low pause collector.
When would you use the CMS Collector?
When you want to minimize GC pauses (frequent requirement for websites and interactive applications)
Does CMS require more cpu and memory than the default collectors?
Yes. You need adequate CPU resources (multiple processors) as CMS adds CPU overhead by using a background thread for the concurrent phases. You need adequate memory to allocate slightly larger heaps than you would for the default collectors, as objects will continue to enter the old generation during the mostly concurrent phases.
How do you enable the CMS Collector?
Use the JVM flag -XX:+UseConcMarkSweepGC. When you do this, -XX:+UseParNewGC is implicitly used. However, you may explicitly specify -XX:+UseParNewGC if you wish (but it’s just redundant).
Note: You cannot use the default collector or the parallel scavenge collector (-XX:+UseParallelGC) in the Young Generation when using CMS in the old generation. CMS is tightly coupled with ParNewGC in the young generation. ParNewGC is an enhanced version of the parallel scavenge collector that enables GC to be done in the young generation while CMS is in progress in the old generation.
Does the CMS Collector require tuning?
You’re lucky if the CMS collector gives you optimal performance by just enabling it with -XX:+UseConcMarkSweepGC. Every Hotspot 1.4.2 JVM I’ve come across (enterprise systems), has required some CMS tuning for optimal performance. Of course, this requirement entirely depends on your application’s object profile. But, if tuning your Hotspot 1.4.2 is required, then tuning CMS requires more effort than tuning the default collectors and CMS has a bunch of JVM flags to play around with. Some important JVM flags to consider when tuning CMS are given below:
What do you need to watch out for when using CMS (problems/gotchas)?
-
The dreaded concurrent mode failure – a failure which occurs when CMS’ concurrent GC phases are interrupted for certain reasons and a Serial, Mark-Sweep-Compact GC is required.
-
Default SurvivorRatio=1024 and Default MaxTenuringThreshold=0. Note that these are default values only when using CMS with JVM 1.4.2 and can trouble you if you’re tuning your JVM for short-lived objects. If your application creates mostly short-lived objects and you wish to use the Young Generation as a filter to retain these objects as long as possible and clean them up with minor GCs (parallel scavenges) to reduce the pressure on the CMS collector, then you must change these default values as these default values ensure that the survivor spaces are not used. Refer this article to understand the peculiarities of MaxTenuringThreshold.
-
The value set by –XX:CMSInitiatingOccupancyFraction is used as same threshold for both old and permanent generation occupancies. i.e. CMS GC will be initiated in the old and permanent generations when either one of or both the old and permanent generation occupancy exceeds the value of CMSInitiatingOccupancyFraction. This is inconvenient and it implies that you must pay close attention to permanent generation occupancy also and size the permanent generation appropriately.
-
The -XX:+CMSClassUnloadingEnabled -XX:+CMSPermGenSweepingEnabled JVM flags could increase remark pauses, but can contain permanent generation growth (prevent OutOfMemory errors caused by a full permanent generation) and protect against poor GC in old generation (objects in the old generation that are referenced by classes in the permanent generation will not be collected until the classes in the permanent generation are collected).
What tools are available to assist you with JVM tuning?
First and foremost, before tuning your 1.4.2 JVM, ensure you profile your application and resolve application issues (e.g. memory leak). To tune your JVM, you have tools which broadly fall under two categories:
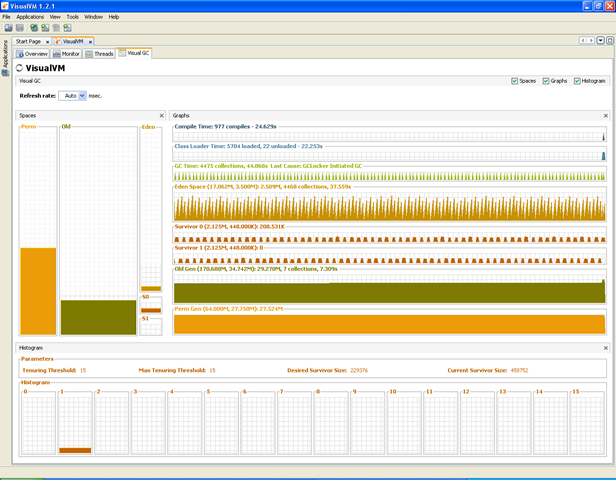
Runtime Monitoring: These tools attach to your JVM to provide loads of runtime data. These tools are useful, when you’re monitoring your JVM in runtime and using these tools interactively. An excellent tool is VisualVM and its VisualGC plugin. A screenshot of the VisualGC plugin is given below:
GC Log File Analysis: These tools enable you to do offline analysis of GC log files and prepare reports for trend analysis. If you wish to run a load test for a couple of hours and measure performance after the test, then you will need to capture GC logfiles and analyze them with such tools. Now, in this area, Sun has been lacking good tools. HP chose a wise strategy of defining a specific format for GC logfiles generated by HP JDKs and developing the excellent HPjmeter to parse the logfiles and create fancy charts along with several metrics. Well, the Sun forums indicate that a GCHisto plugin is being developed to analyze Hotspot GC log files. I have tried out this plugin (beta) and found it to be nowhere as comprehensive and sophisticated as HPjmeter. Well, will wait for GCHisto to be completed and plugged into VisualVM before trying it out again.
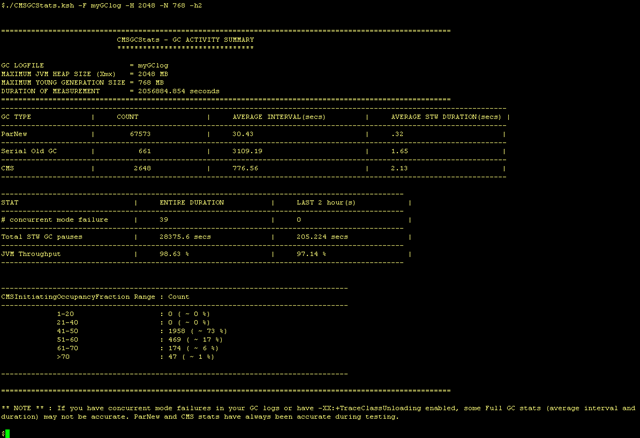
In order to assist my colleagues and me with Hotspot JVM 1.4.2 GC log file analysis when using CMS, I’ve developed a quick-and-dirty korn shell script to provide a summary of some key GC metrics for a specific GC logfile. You may download the script CMSGCStats.ksh and execute it without arguments (ksh CMSGCStats.ksh) for usage tips. Refer a sample screenshot of the script’s output below:
References:
(1) JVM 1.4.2 Garbage Collectors
| COLLECTOR | GENERATION | JVM FLAGS TO TURN ON | DESCRIPTION |
| Serial | Young | None. Default. | Single-threaded, stop-the-world, copying collector |
| Parallel Scavenge | Young | -XX:+UseParallelGC | Multi-threaded, stop-the-world, copying collector (not to be used with CMS) |
| ParNew | Young | -XX:+UseParNewGC |
Multi-threaded, stop-the-world, copying collector to be used along with CMS. This option is automatically turned on when using CMS and doesn’t have to be explicitly specified. |
| Serial Old | Old | None. Default. |
Single-threaded, stop-the-world, mark-sweep-compact collector |
| CMS | Old | -XX:+UseConcMarkSweepGC |
Mostly concurrent low-pause collector that uses a background thread for the concurrent phases. |


